playbook部署ELK日志系统
前话
ansible管理集群是真的强啊。之前手动一步一步搭建ELK切换来切换去的很是麻烦,但是这次尝试使用playbook,直接给弄好,便捷啊
编写playbook
不多说,直接上脚本
 1
 2
 3
 4
 5
 6
 7
 8
 9
10
11
12
13
14
15
16
17
18
19
20
21
22
23
24
25
26
27
28
29
30
31
32
33
34
35
36
37
38
39
40
41
42
43
44
45
46
47
48
49
50
51
52
53
54
55
56
57
58
59
60
61
62
63
64
65
66
67
68
69
|
---
- name: 环境准备
hosts: all
tasks:
- name: 环境准备
script: /root/elk.sh
- name: es集群部署
hosts: all
tasks:
- name: 安装redis,nginx,java
yum: name={{item}} state=latest
with_items:
- redis
- nginx
- java
- name: 安装es
shell: "rpm --install ./elasticsearch-2.4.2.rpm"
- name: 修改data文件夹权限
shell: "chown -R elasticsearch:elasticsearch /data/"
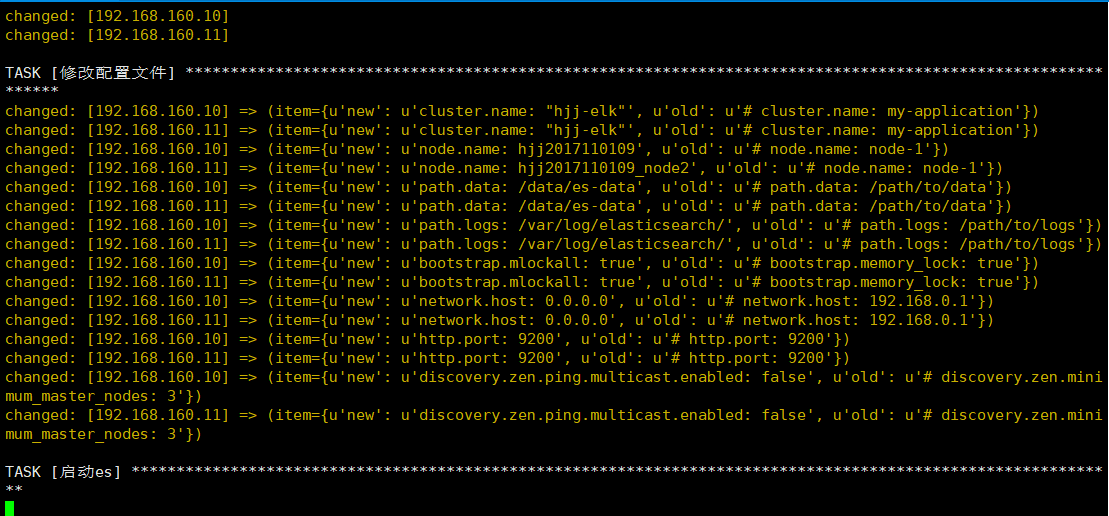
- name: 修改配置文件
lineinfile:
path: /etc/elasticsearch/elasticsearch.yml
regexp: "{{item.old}}"
line: "{{item.new}}"
with_items:
- {old: '# cluster.name: my-application',new: 'cluster.name: "hjj-elk"'}
- {old: '# node.name: node-1',new: 'node.name: {{ ansible_nodename }}'}
- {old: '# path.data: /path/to/data',new: 'path.data: /data/es-data'}
- {old: '# path.logs: /path/to/logs',new: 'path.logs: /var/log/elasticsearch/'}
- {old: '# bootstrap.memory_lock: true',new: 'bootstrap.mlockall: true'}
- {old: '# network.host: 192.168.0.1',new: 'network.host: 0.0.0.0'}
- {old: '# http.port: 9200',new: 'http.port: 9200'}
- {old: '# discovery.zen.minimum_master_nodes: 3',new: 'discovery.zen.ping.multicast.enabled: false'}
- name: 启动es
service:
name: elasticsearch
state: started
enabled: yes
- name: head和kopf插件安装
hosts: all
tasks:
- name: head
shell: '/usr/share/elasticsearch/bin/plugin install mobz/elasticsearch-head'
- name: kopf
shell: '/usr/share/elasticsearch/bin/plugin install lmenezes/elasticsearch-kopf'
- name: logstash部署
hosts: all
tasks:
- name: 安装logstash
shell: "rpm --install ./logstash-2.1.3-1.noarch.rpm"
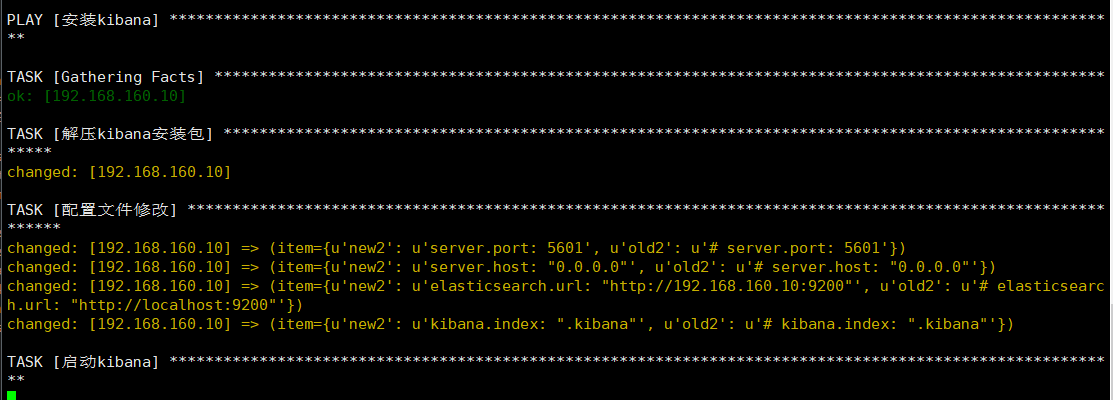
- name: 安装kibana
hosts: 192.168.160.10
tasks:
- name: 解压kibana安装包
unarchive: src=/root/app/kibana-4.3.1-linux-x64.tar.gz dest=/root/app/
- name: 配置文件修改
lineinfile:
path: /root/app/kibana-4.3.1-linux-x64/config/kibana.yml
regexp: "{{item.old2}}"
line: "{{item.new2}}"
with_items:
- {old2: '# server.port: 5601',new2: 'server.port: 5601'}
- {old2: '# server.host: "0.0.0.0"',new2: 'server.host: "0.0.0.0"'}
- {old2: '# elasticsearch.url: "http://localhost:9200"',new2: 'elasticsearch.url: "http://192.168.160.10:9200"'}
- {old2: '# kibana.index: ".kibana"',new2: 'kibana.index: ".kibana"'}
|
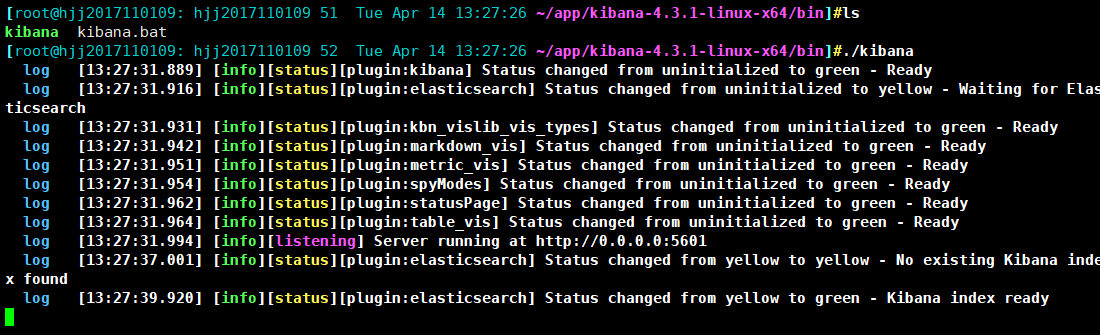
步骤是,先利用shell脚本准备环境,然后安装redis,nginx,java,由于es下载很慢(后面的logstash也是的,所以事先将rpm包上传上去了,直接使用shell模块用rpm命令安装),接着配置文件,安装插件head和kopf,然后就是安装logstash和kibana了。但是每次执行到运行kibana的时候卡死,所以就直接安装,不运行了。
编写环境准备shell脚本
这个脚本主要是来做hosts映射,建立/data/es-data文件夹,以及先准备好收集系统日志的conf文件
 1
 2
 3
 4
 5
 6
 7
 8
 9
10
11
12
13
14
15
16
17
18
|
#!/bin/bash
echo "192.168.160.10 hjj2017110109
192.168.160.11 hjj2017110109_node2" >> /etc/hosts
mkdir -p /data/es-data
echo "input {
file {
path => "/var/log/messages"
type => "system"
start_position => "beginning"
}
}
output {
elasticsearch {
hosts => ["192.168.160.10:9200"]
index => "system-%{+YYYY.MM.dd}"
}
}" >> /root/file.conf
|
开始执行剧本
先用语法检查,看看有无错误

然后开始执行剧本
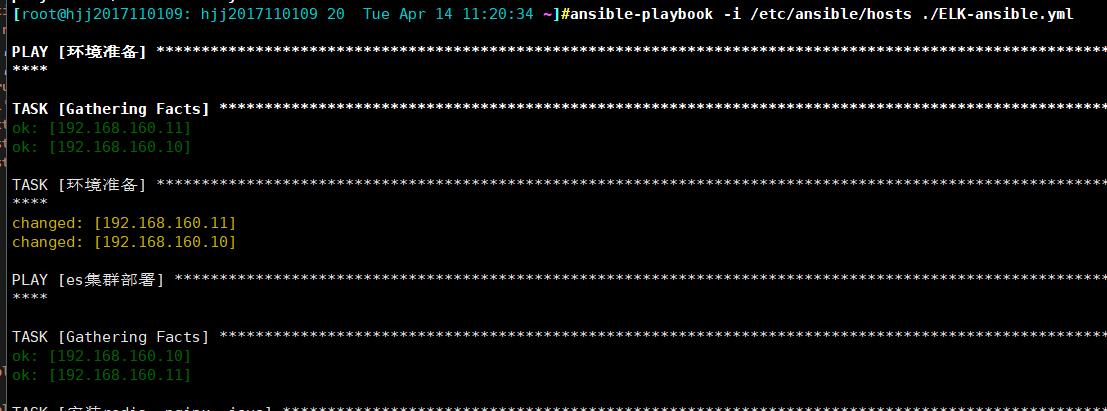
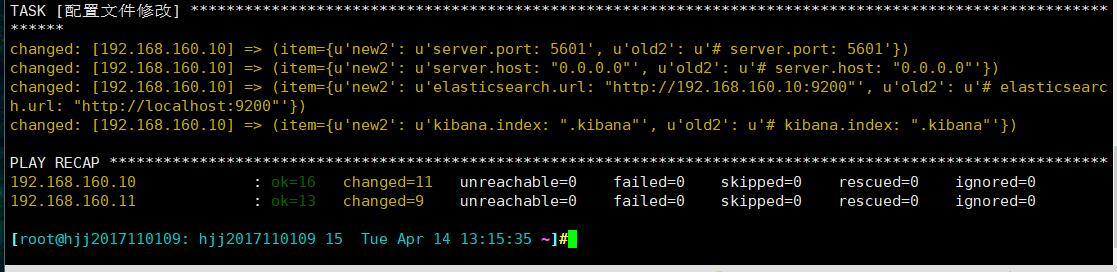
安装完成
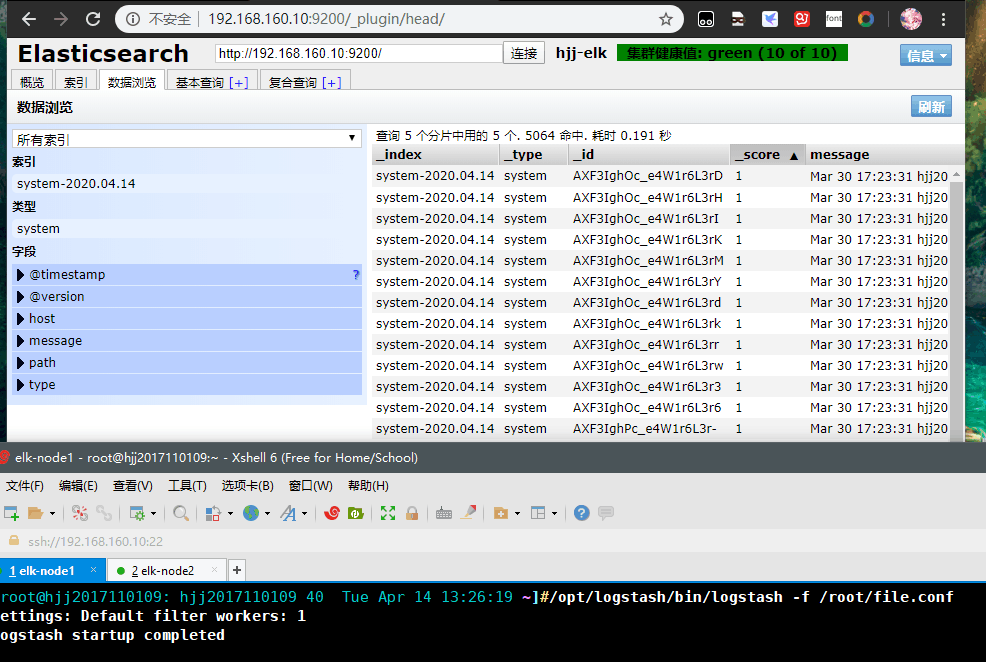
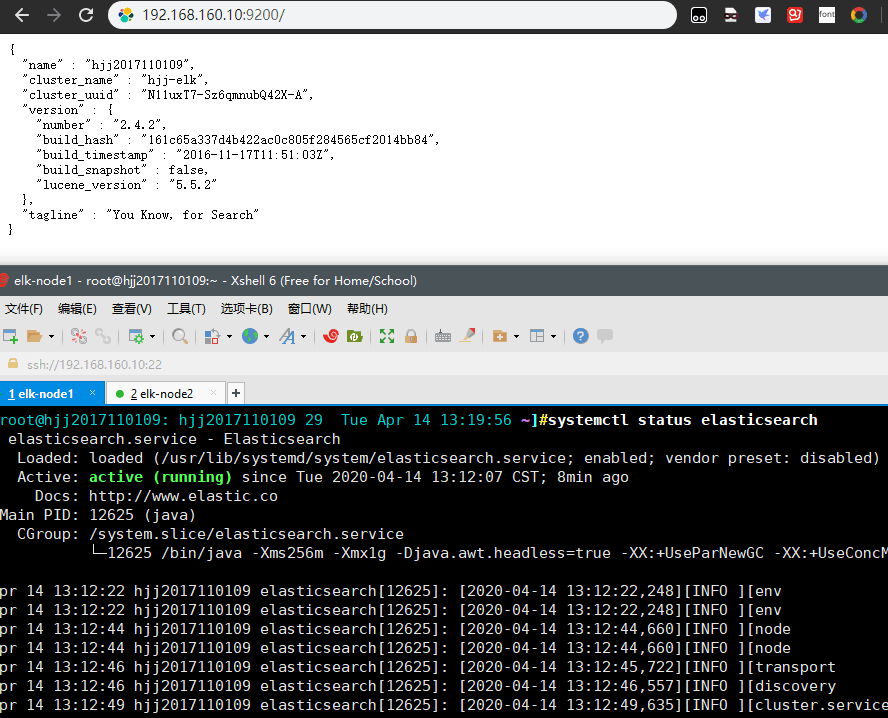
进入web查看
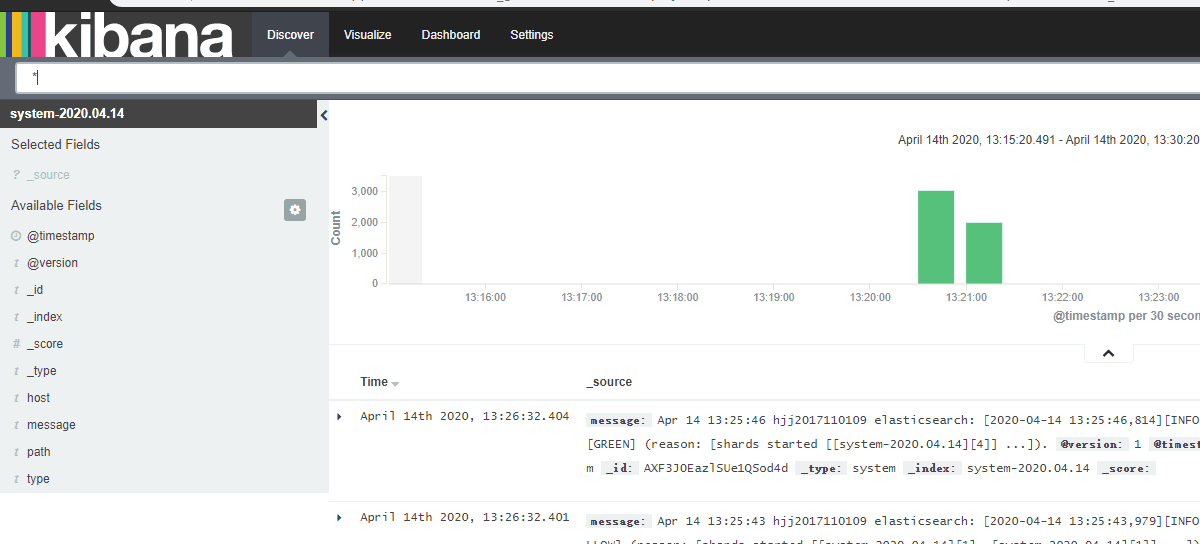
然后收集系统日志